


In the early 1970s, economic growth was transforming the South and West, and Western railroads surpassed Eastern roads in ton-miles carried for the first time in 1971. Traffic declines in the East heped trigger a rash of bankruptcies, which spurred Congress to commission detailed studies of railroad lines and operations. The results warned that, absent fundamental policy changes, the crisis would not be confined there.
Shown here are the traffic densities on the busiest U.S. main lines in the early ’70s. The lightest routes depicted are those carrying 10 million gross tons per year. (Gross tonnage includes the weight of locomotives, cabooses, loaded commodities, and empty cars.) One federal study published in the ’70s noted that routes below a threshold of 20 MGT had significantly higher maintenance and operating costs per ton-mile, and that there were far more miles of track below 20 MGT than above it. In the early part of the decade — when the U.S. rail network totaled 206,400 miles — 33% of the mileage carried a mere 1% of the traffic, while 67% of the traffic funneled on just 20% of the route-miles.
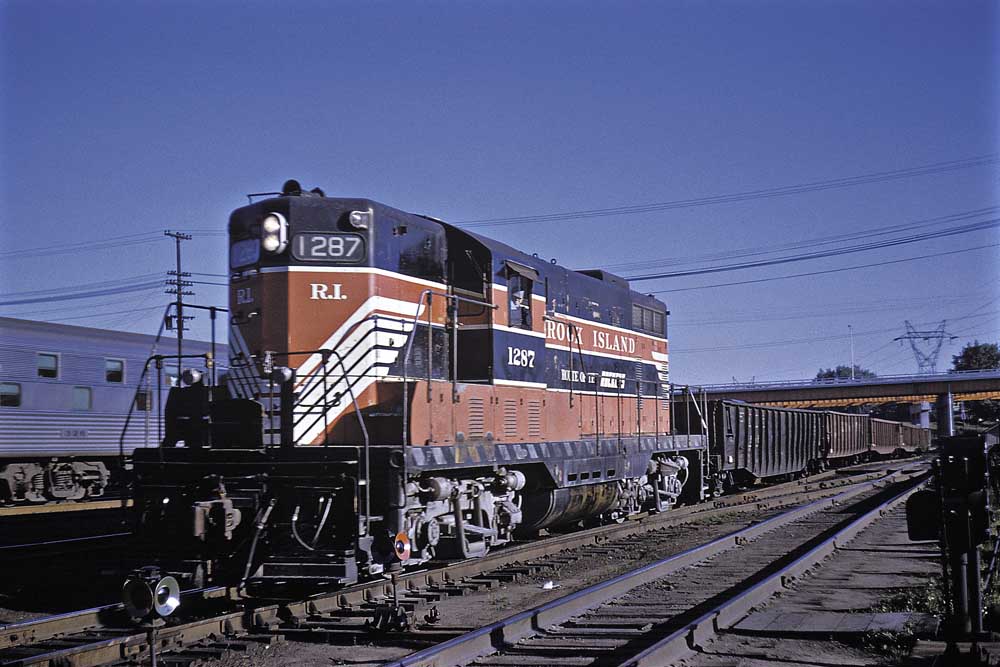
Light-density lines in the East were often commuter routes, or led to forsaken mill towns and anthracite coalfields; in the Midwest, they were grain-gathering spurs. Everywhere, they were a drain on resources. So, too, were main lines that, on the map, disappear as traffic thins out. Note the “gap” in Rock Island’s Golden State Route in Kansas, or the abrupt end of lines such as Santa Fe’s passenger route in Kansas, Milwaukee Road’s Pacific Extension in South Dakota, and the Lehigh Valley in eastern Pennsylvania.
Recognizing the dire situation, the Interstate Commerce Commission in 1972 streamlined its procedure for railroad abandonment — over the objection of several states. By the early 1980s, a number of lightly used main lines would be abandoned, downgraded, or sold. Other light-density routes, such as the BN across western Nebraska, would see their fortunes revive in the ’80s and ’90s, thanks to deregulation, mergers, and the growth of intermodal traffic and Powder River Basin coal.
Railroads included in this map:
Atchison, Topeka & Santa Fe; Baltimore & Ohio; Bessemer & Lake Erie; Boston & Maine; Burlington Northern; Chicago & Eastern Illinois; Chicago & North Western; Chicago, Milwaukee, St. Paul & Pacific; Chicago, Rock Island & Pacific; Clinchfield; Delaware & Hudson; Denver & Rio Grande Western; Detroit & Toledo Shore Line; Detroit, Toledo & Ironton; Duluth, Missabe & Iron Range; Duluth, Winnipeg & Pacific; Elgin, Joliet & Eastern; Erie Lackawanna; Grand Trunk Western; Illinois Central Gulf; Kansas City Southern; Lehigh Valley; Long Island; Louisiana & Arkansas; Louisville & Nashville; Maine Central; Metropolitan Transportation Authority; Missouri-Kansas-Texas; Missouri Pacific; Norfolk & Western; Penn Central; Pittsburgh & Lake Erie; Reading; Richmond, Fredericksburg & Potomac; Seaboard Coast Line; St. Louis-San Francisco; St. Louis Southwestern; Southern Pacific; Texas & Pacific; Union Pacific; Western Maryland; Western Pacific


Lots of missing lines. Not sure what the criteria was to include some lines and not others or only parts of lines.