


WASHINGTON — The latest figures for U.S. rail traffic are extremely familiar: carload numbers are comparable to 2022, while intermodal volume is down significantly.
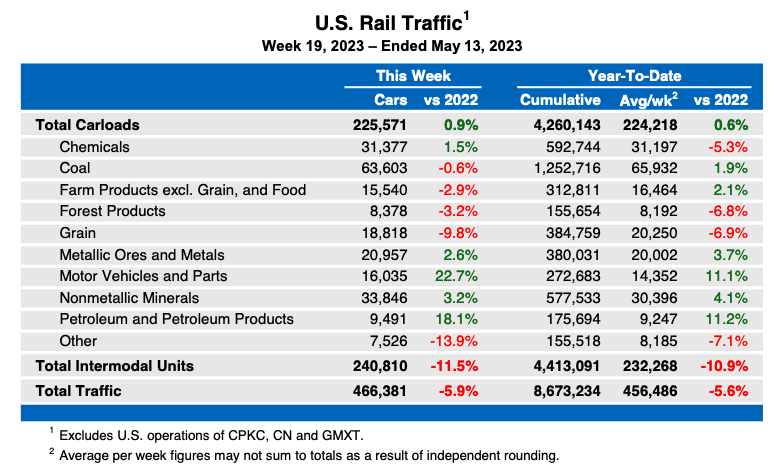
The specifics from the Association of American Railroads, for the week ending May 13, show 466,381 carloads and intermodal units, a 5.9% decline from the corresponding week a year ago. That includes 225,571 carloads, up 0.9%, and 240,810 containers and trailers, down 11.5%.
Year-to-date totals, through 19 weeks, show carload traffic up 0.6% and intermodal units down 10.9%, with weekly averages of 224,218 carloads and 232,268 intermodal units, for a total week average of 456,486 carloads and intermodal units.
The week’s North American figures, for 12 reporting U.S., Canadian, and Mexican railroads, show 332,478 carloads, an increase of 2.1% from the same week in 2022; 322,290 intermodal units, a decrease of 12.15, and total volume of 654,868 carloads and intermodal units, down 5.4%. Total volume for 2023, through 19 weeks, is down 4.0% from the same period in 2022.


The loss of coal is the hole in traffic.
The economy is certainly slowing. The only thing propping it up is Federal spending.
It took our country 224 years to accumulate $6 trillion in debt.
In the next 20 years it accumulated another $16 trillion in debt.
In the last two years it has accumulated $9 trillion in debt to get to the current $31 trillion.