


WASHINGTON – The Class I railroads submitted their first batch of expanded performance metrics to federal regulators this week, including a snapshot of on-time performance data.
The board on May 6 ordered the railroads to report the data beginning this week in response to shipper complaints and testimony delivered during two days of hearings last month on widespread rail-service problems at the big four U.S. Class I systems, BNSF Railway, CSX Transportation, Norfolk Southern, and Union Pacific.
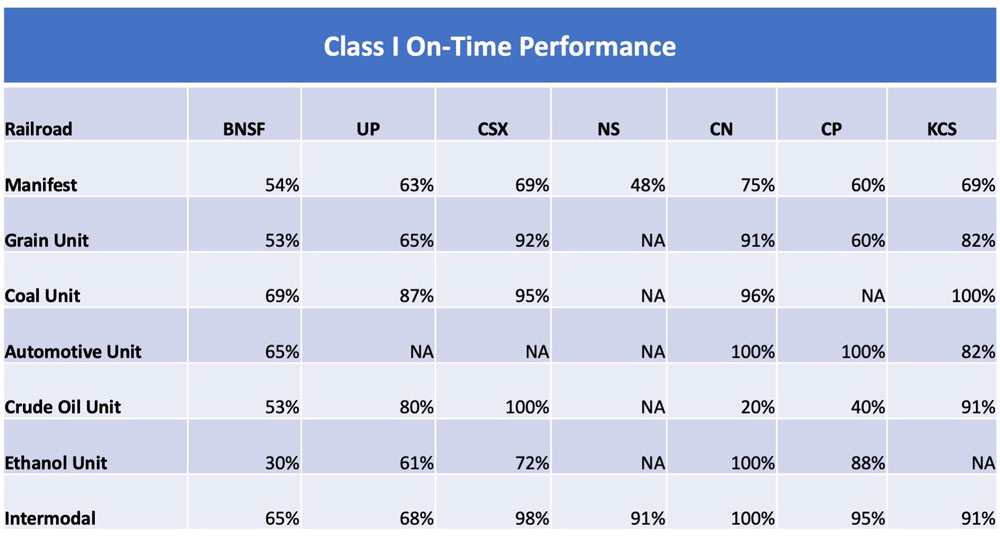
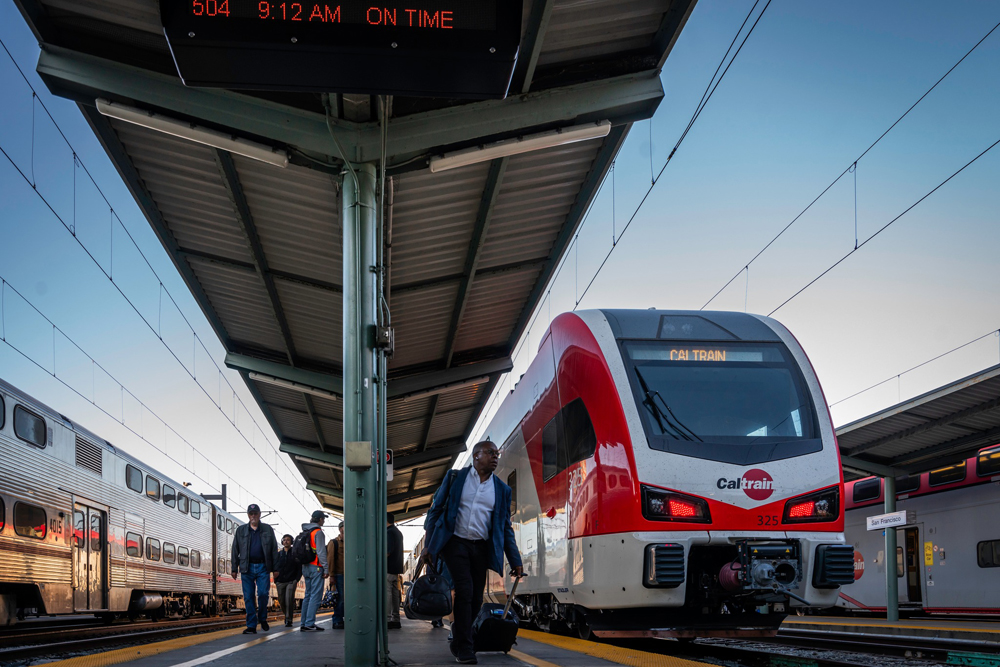
The intermodal on-time performance data showed BNSF and UP struggling in the West, while CSX and NS were both running well in the East. On-time performance for manifest – or carload – traffic at the big four U.S. systems ranged from a low of 48% at NS to a high of 69% at CSX.
The STB asked the railroads to provide data on how many carloads and intermodal trains arrived at their destinations within 24 hours of their original arrival estimates. The railroads’ internal trip-plan compliance figures are much tighter than what they are reporting to the board.
The railroads have said that crew shortages are the culprit for erratic service and congestion on their networks. The shortages have been compounded by not having locomotives in the right places at the right times as well as the need to recrew trains that have to stop en route when their crews reach the maximum number of hours they may work.
BNSF and UP had the highest recrew rates last week, at 12% and 10%, respectively, of their daily road trains. The BNSF recrew rate in California was 20%, while UP’s in Southern California was 21%. BNSF also was recrewing at high levels in Texas, where 24% of trains on the Red River subdivision required a second crew. When BNSF is operating well, a typical recrew rate would be around 5%.
In the East, CSX and NS fared better. CSX reported a 1% overall recrew rate, while NS said 4% of its trains were recrewed last week.
UP told the board that it has not embargoed any shippers’ traffic as a way to reduce congestion on its network. UP had warned shippers last month that it would begin metering traffic as a way to reduce the number of cars in the system. Instead, the railroad says it’s working with shippers so that voluntary agreements can be reached.
The Class I railroads also reported local service metrics to the STB for the first time. Shipper organizations have long sought such first- and last-mile performance data. The STB is considering adopting a rule that would require the railroads to permanently provide local service data.
The board is temporarily requiring the railroads to report the percentage of scheduled spots and pulls that were fulfilled, both systemwide and on a divisional basis. Systemwide totals reported for last week were 91% for UP; 88% for BNSF; 83% for CSX; and 74% for NS.
The Association of American Railroads pushed back against the expanded performance data requirements.
“There is no explanation by the Board of how specific pieces of requested information will assist it in monitoring the current service challenges. Nor is there any explanation why the Board’s current robust service reporting rules are insufficient for its purposes. Without notice and comment, there has been no opportunity for stakeholders to help tailor the data to be collected to the needs of the Board given the current circumstances in the United States. Nor could stakeholders ensure that the Board was ordering publication of information that would be useful to it and not confusing or misleading to the public,” J. Frederick Miller Jr., an AAR lawyer, wrote to the board in a letter dated May 18.
The railroads “appreciate the urgency of service problems being experienced by many customers and respect the Board’s efforts to respond and assist,” Miller wrote. But he urged the board to follow its rulemaking processes if it decides to make the temporary reporting metrics permanent.
Canadian National “cautioned against drawing conclusions across railroads based on these data submissions” because of differences in the way each Class I collects and calculates its operational metrics.
That was apparent in the railroads’ average daily train start data, where CSX appears to use a different methodology than the other Class I systems.
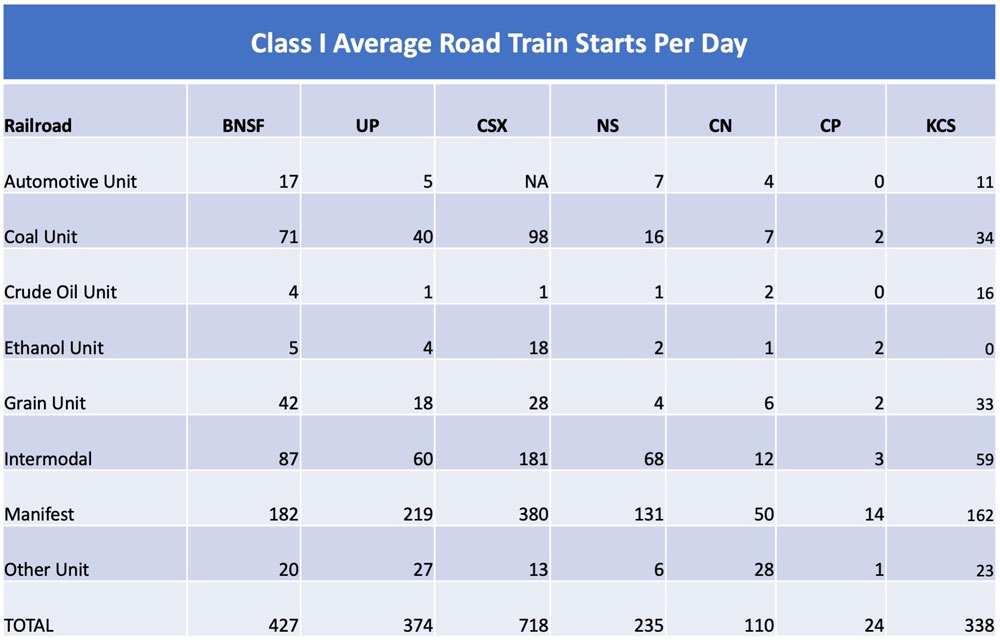
In CSX’s case, it reported the total number of crew starts for road trains per day rather than the daily average number of road train starts. The two are different: Road train starts includes only trains that depart their originating terminals on a particular day; crew starts would include those originating trains as well as crew changes for trains already en route.
The board had requested the daily train start tally in order to provide perspective on trains held per day information that the railroads already reported weekly.
Kansas City Southern’s daily train start figures also seemed significantly higher than warranted when compared to its traffic volume and the averages reported by the other, much larger Class I systems. KCS says its train start data was incorrect and will be resubmitted.


You can’t tell me that CSX doesn’t know the difference be crew starts and road train starts…that looks like obfuscation to me.
“Precision Schedulled” Railroading is it? They can’t be on time by calendar, much less a clock. What percent arrived the same month they were due?
Back in the day, if the hotshot from Chicago was one hour late a white hat was out to find out why. Of course there was competition then.
Two rules of thumb of American frieght railroading: (When the system works, as opposed to when it doesn’t work, like now).
(1) Shipping times are measured in multiples of 24 hours. Delays therefore are measured in mutliples of 24 hours. Connections are measured in multiples of 24 hours, if the conection happens at all.
(2) A rail line might have any number of freight trains (in each direction) daily. The number of daily trains that can carry your individual load each day is, at a maximum, one.
Are individual RRs asking the AAR to complain because they are not willing to voice individual complaints?
The STB needs to require a standard set of reports from all RRs. Different ways to calculate just breeds lying.
Well, if the AAR is unhappy, somebody must be doing something right.
Interesting that NS has the highest number of on-time “NA”‘s. Wonder what numbers they’re hiding. Maybe that’s why their stock took a hit today.