


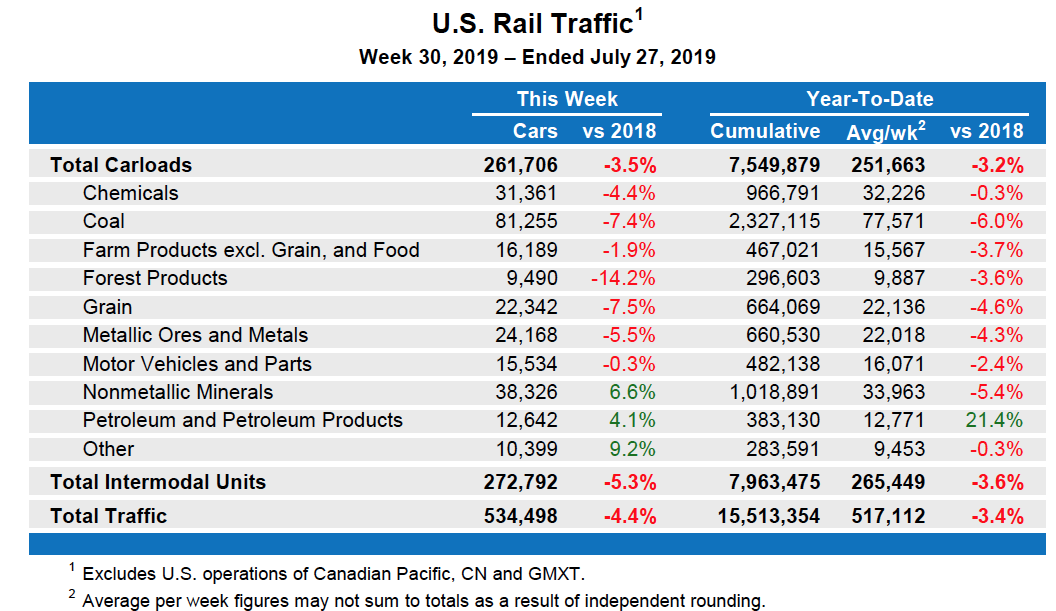
For this week, total U.S. weekly rail traffic was 534,498 carloads and intermodal units, down 4.4% compared with the same week last year.
Total carloads for the week ending July 27 were 261,706 carloads, down 3.5% compared with the same week in 2018, while U.S. weekly intermodal volume was 272,792 containers and trailers, down 5.3% compared to 2018.
Three of the 10 carload commodity groups posted an increase compared with the same week in 2018. They were nonmetallic minerals, up 2,381 carloads, to 38,326; miscellaneous carloads, up 880 carloads, to 10,399; and petroleum and petroleum products, up 500 carloads, to 12,642. Commodity groups that posted decreases compared with the same week in 2018 included coal, down 6,517 carloads, to 81,255; grain, down 1,812 carloads, to 22,342; and forest products, down 1,576 carloads, to 9,490.
For the first 30 weeks of 2019, U.S. railroads reported cumulative volume of 7,549,879 carloads, down 3.2% from the same point last year; and 7,963,475 intermodal units, down 3.6% from last year. Total combined U.S. traffic for the first 30 weeks of 2019 was 15,513,354 carloads and intermodal units, a decrease of 3.4% compared to last year.
North American rail volume for the week ending July 27, on 12 reporting U.S., Canadian and Mexican railroads totaled 366,406 carloads, down 2% compared with the same week last year, and 362,227 intermodal units, down 4.3% compared with last year. Total combined weekly rail traffic in North America was 728,633 carloads and intermodal units, down 3.1%. North American rail volume for the first 30 weeks of 2019 was 21,160,196 carloads and intermodal units, down 2.3% compared with 2018.
Canadian railroads reported 83,805 carloads for the week, up 2.8%, and 70,776 intermodal units, down 0.9% compared with the same week in 2018. For the first 30 weeks of 2019, Canadian railroads reported cumulative rail traffic volume of 4,527,710 carloads, containers and trailers, up 2.1%.
Mexican railroads reported 20,895 carloads for the week, down 2.2% compared with the same week last year, and 18,659 intermodal units, down 1.7%. Cumulative volume on Mexican railroads for the first 30 weeks of 2019 was 1,119,132 carloads and intermodal containers and trailers, down 3.3% from the same point last year.
— An Association of American Railroads news release. July 31, 2019


Precision Scheduled Railroading. If one reads the published information in transportation journals, one will discover that the general shipping population is not pleased with what the railroads are offering for service. Read train magazines from 15 years ago and one will discover too, that PSR is the antithesis to what is needed to capture new customers and retain them. Running extremely long trains may work in Canada, but for the U.S. markets the new strategy will not cut it. Right now the transportation market is soft and typical shippers that can use either rail or truck for their needs are abandoning railroads at an alarming rate. What the typical Class 1 railroad is offering for service just is not meeting the needs of many shippers. If and when trucking tightens up, maybe some shippers will return. The railroads just continue to p**s a lot of customers off.
Approximately 225,000 jobs were created in June 2019. The national unemployment rate is at 3.7%. Yet, the railroads are carrying less and less traffic. Go figure?
Mr. Norton and Mr. Stark,
All of the jobs reports have been misleading based on the simple fact that most of the newly created jobs are PART TIME and not full time employment. Government statistics do not differentiate between the two, all they see is a person going off the Unemployment rolls and being added to the employment rolls, whether that’s for 10 hours a week or 40/week doesn’t matter.
P.S. GDP has nothing to do with purchasing power of the consumer, and this is a consumer driven economy. Anyone with common sense could triple economic growth simply by putting more spending money in the pocket of the lower middle and middle middle class citizens. Of course neither railroad executives, Wall Street nor anyone in D.C. has common sense…witness PSR and the quest to drop OR to the smallest number possible,
Mr. Stark: According to MarketWatch consumer confidence is near an 18-year high. Also, during 2018 GDP increased 3.1 percent making it the fastest fourth quarter growth since 2005. I look around and new construction is everywhere.
Its not the current economy. The railroads are running customers away for short term gains. Rail freight would most likely increase under re-regulation of which I tend to think looks better and better.
The jobs numbers do not tell the whole story as salaries are stagnant and new jobs pay less and less as manufacturing jobs are replaced by lower paying service jobs. People who get paid less buy less and the consumer is 70% of our economy. Companies that sell less ship less.