


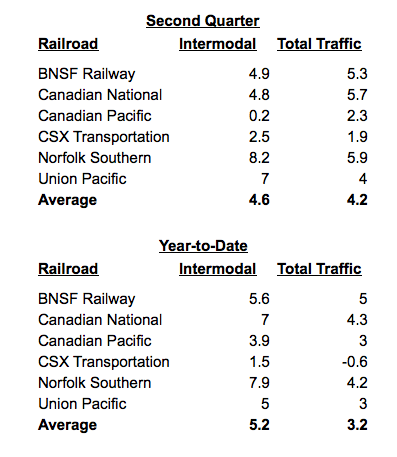
BNSF Railway led the industry in growth through June 30, with traffic up 5 percent overall, according to its latest Association of American Railroads weekly carload report.
At the other end of the spectrum, CSX Transportation’s total traffic was down 0.6 percent for the first six months of the year due to a decline in carload volume and the impact of intermodal service changes.
Last fall CSX shed 7 percent of its intermodal volume when it scuttled its hub-and-spoke intermodal network, which served low-volume origins and destinations. Despite the tough comparison, CSX’s intermodal volume was up 1.5 percent for the first half of this year.
The industry’s intermodal champion, for both the second quarter and year to date, is Norfolk Southern. Its intermodal volume was up 8.2 percent for the quarter and 7.9 percent for the first half of the year.
For the second quarter, NS led the industry in overall growth, too, with its traffic surging 5.9 percent, squeaking by Canadian National’s 5.7-percent volume growth.
Both railroads continue to experience congestion issues, with NS bogged down on the southern reaches of its network and CN clogged on its key corridor linking Edmonton, Alberta; Winnipeg, Manitoba; and Chicago.
The impact of a pair of strike-related shutdowns at Canadian Pacific in April and May showed in its preliminary traffic counts. The Teamsters Canada Rail Conference, which represents train crews on CP’s lines in Canada, threatened to strike in April, then briefly struck the railroad in May.
CP’s intermodal volume was flat in the second quarter, while overall traffic was up just 2.3 percent. For the first half of the year, CP’s intermodal volume is up 3.9 percent, while overall traffic is up 3 percent.
Union Pacific reported strong intermodal growth for the second quarter, with volume up 7 percent in part due to landing the contract to handle Ocean Network Express, or ONE, international intermodal business at West Coast ports.
UP has long lagged BNSF in volume growth, but topped BNSF’s intermodal growth of 4.9 percent in the second quarter.
Tight trucking capacity has helped railroads gain volume, says Larry Gross, an analyst with Gross Transportation Consulting. But the gain has primarily come in intermodal.
“I don’t think there is a lot of overlap between rail carload and truck these days,” Gross says.
Carload growth was strong in the second quarter, at 4.2 percent. Truck capacity was tight in the first quarter, as well, but carload growth was only 0.3 percent.
“So I think whatever strength we are seeing right now in carload is more a function of a spurt in the economy rather than share shift,” Gross says.
It’s a different story for domestic intermodal, which Gross calls the battleground between rail and truck. And to a certain extent, the service problems at some of the Class I systems meant that railroads could not fully capitalize on the opportunity to gain share.
“Intermodal volume was definitely constrained in in the first quarter by lower equipment velocity and consequent shortages in domestic container capacity. In particular we saw disruptions in the rail-owned container fleet productivity due to some friction between the railroad partners,” Gross says. “So volume was left on the table — or should I say, the highway.”
The situation has improved in the second quarter, but complete intermodal data from the Intermodal Association of North America is not yet available.
“My sense is that intermodal gained share in the second quarter and perhaps held its own in the first quarter,” Gross says.
John Gray, the AAR’s senior vice president of policy and economics, says rail volumes show the economy is humming along.
“In June, 14 of the 20 commodity categories the AAR tracks each month saw carload gains – the third straight month in which at least 14 categories were up. That’s the longest such streak since late 2014,” Gray says. “Meanwhile, record intermodal volume for June speaks to the high value proposition that rail customers associate with intermodal service. For now, things are looking good for the railroads and the economy despite the many threats, such as a potential trade war, that could bring change quickly.”
North American rail volume for the first 26 weeks of 2018 was 18.7 million carloads and intermodal units, up 3.3 percent compared with 2017.
Of note in the intermodal traffic figures: The continued spike in trailer volume, which for the second quarter was up 27 percent on BNSF and 22 percent on NS and UP. Trailers have been in decline for years as containers became the favored way to move domestic shipments due to the cost advantages of double-stack trains.
Gross attributes the rise in containers to two things. The first is shippers looking for intermodal capacity but can’t find a domestic container. The second is truckers who have loads but not enough drivers or containers and instead put their trailers on flatcars.


I appreciate the presumption that I’m an insider (though I was one for a few years albeit in IT), I do consider myself a serious student of the industry nonetheless. So I’ll take a crack, while opening to any longer term and more knowledgeable business side insiders to correct or clarify any of what I’m about to say.
I think basically that trip plans are created and tracked for every individual shipment, usually but not always a single carload or a container/trailer (unit trains may be treated differently) and consider the entire cycle the railroad is responsible for, including spotting empties when requested and placing cars for unloading or what happens to a container or trailer from the point it “ingates” into an origin ramp or is made available for a dray pick up at a destination ramp.
So in that sense it encompasses all performance measures attributable to the railroad in some fashion on a per shipper per shipment basis. So you can get to an aggregate measure of service provided to the customer from it.
As compared to per train measures of velocity between terminals or terminal dwell which to my mind overaggreate across all shipments regardless of distance or profitability or what have you (which clearly a railroad has some incentive to treat differently but would not necessarily want to be 100% transparent about).
So tl;dr good trip plan performance requires good train metrics but good train metrics can hide bad (or sub par) trip plan performance.
Paul:
Can’t you give us outsiders a tutorial on these “trip plans”? How are they composed and what do they look like to a conductor or yardmaster? Are they simply a digital notation on a computer screen? What do waybills look these days, or do they even still exist? Thanks.
I think the growth in truck-transload-carload suggests that there can be share shift from truck to rail carload. Because many such “commodity” truckloads can choose between staying on the highway to the destination or taking the short haul to the transload terminal.
This depends on service reliability and cost, both of which are (slowly) improving as the number of transload terminals on hustling short lines grows. And as the class 1s (slowly) replace hump yard handling with block for destination terminals and en route block swaps along with shifting to trip plan rather than train performance KPI metrics. Better overall velocities help on the cost side too in terms of fewer rolling stock assets better utilized.
On domestic Intermodal I’ve been saying interchange friction has been an issue for awhile and the Larry Gross quote seems to affirm that. To that point it would be interesting to know what fraction of the NS domestic IM growth involves interchange in Chicago or Memphis versus O/D pairs solely on NS (or affiliated services like PanAm to Ayer, MA or KCS Meridian-DFW or UP ATL-SoCal).
When the chassis supply gets figured out. Then maybe containers will grow. The single biggest problem’s conatiners waiting for chassis that aren’t available