This Map of the Month was featured in the June 2003 issue of Trains magazine.
We know railroads experienced a lot of traffic growth since they were deregulated in 1980, but where? And more importantly, which lines did better or worse than average?
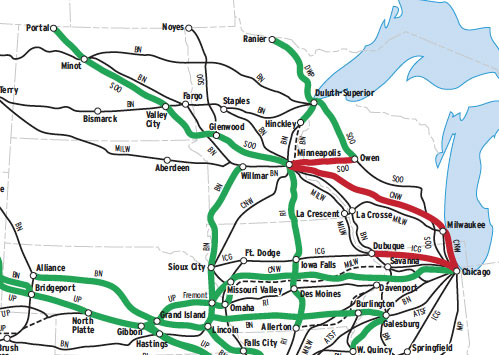
This map of western main lines compares the growth rate in tonnage between 1979, the last full year prior to deregulation, and 2001.
In that 22-year period, Western traffic (in gross ton-miles) grew 65 percent overall. Line segments shown in red performed much worse than average; those in green, much better; those in dashed black were abandoned, shortlined, railbanked, or closed to through business; and those in solid black have been, well, just average.
The key trends were mergers, coal, and NAFTA (the North American Free Trade Agreement). Mergers consolidated traffic onto fast, short, low-cost lines, and starved slow, long, high-cost lines. Some examples: the Missouri Pacific vs. the Southern Pacific east of Sierra Bianca, Texas; the Katy from Kansas City to Fort Worth vs. the MoPac to Wagoner, Okla.; the Union Pacific east of Denver vs. the MoPac east of Pueblo, Colo.
Traffic on international routes increased as a result of NAFTA. Note the routes to the Mexico border, and the diversions from all-Canada routes into the U.S. at Eastport, Idaho; Portal, N.D.; and Ranier, Minn.
Powder River Basin coal effected huge growth on BNSF and UP, as one would expect. But the growth for BNSF was exceptional only in the central corridor.
The biggest surprise? The weakness of the SP in the far West.
Notes on methodology: To determine growth rate, gross ton-miles were sampled for 162 line segments and the standard deviation calculated. The mean growth rate 1979-2001 was found to be 65 percent, and the standard deviation 70 percent. Line segments shown in red and green vary by at least one standard deviation; that is, from -5 percent growth to +135 percent growth over the time period.
East and West are divided at the gateways where eastern and western carriers transfer freight: Chicago, St. Louis, Kansas City Memphis, and New Orleans. Illinois Central Gulf is not shown south of Chicago, St. Louis-San Francisco is not shown east of Memphis, and Norfolk & Western is not shown at all. Owners are as of 1979.
Railroads featured in this map:
Atchison, Topeka & Santa Fe; Burlington Northern; Chicago & North Western; Denver & Rio Grande Western; Duluth, Winnipeg & Pacific; Illinois Central Gulf; Kansas City Southern; Chicago, Milwaukee, St. Paul & Pacific; Missouri-Kansas-Texas; Missouri Pacific; Chicago, Rock Island & Pacific; St. Louis-San Francisco; Soo Line; Texas Mexican; Union Pacific; Western Pacific