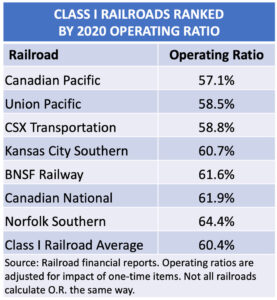
Canadian Pacific won the Class I railroad operating ratio crown for 2020, the first year that three of the big seven systems reported operating ratios below 60%.
CP’s operating ratio, the closely watched measure of railroad efficiency, improved 2.8 points compared to 2019.
Following closely behind CP were Union Pacific, at 58.5%, and CSX Transportation, at 58.8% for the year.
BNSF Railway’s operating ratio declined 2.9 points, the biggest improvement among the Class I systems.
The average operating ratio stood at 60.4%, down from 61.9% in 2019. Operating ratios have been improving for years and are down 10.4 points since 2012.
 The improvement in 2020 came despite the pandemic’s significant impact on traffic and revenue.
The pandemic-related collapse of energy prices significantly reduced the price of diesel fuel, however, which is typically the railroads’ No. 2 expense.
Railroads also reduced their top expense, labor compensation and benefits, as Class I employment in the U.S. continued to decline due to a combination of the pandemic, cutbacks related to the implementation of Precision Scheduled Railroading, and the trend toward moving tonnage on fewer but longer trains.
Overall U.S. Class I employment in December 2020 was 10.4% lower than a year earlier even though combined U.S. carload and intermodal volumes were 5% higher in the final month of 2020 than December 2019.
Not all railroads calculate operating ratio in precisely the same way. The basic formula is the same: Operating ratio is determined by dividing operating expenses by operating revenue. Where the railroads diverge is on whether their calculations also include gains from things like real estate sales.
UP, BNSF, and CN calculate their operating ratios using purely the cash generated from operating their railroads. CSX, CP, and NS, on the other hand, also include gains from selling off property.
CN’s tally also includes the results of its trucking and Great Lakes bulk shipping units, which add a combined 2 points to the company’s operating ratio.