This Map of the Month appeared in the May 2004 issue of Trains magazine. If a system map is an archaeological record of mergers, acquisitions, abandonments, and line sales, then a crew-district map is the record of all of these, plus technological change and traffic pattern change, with a great deal of law and contract negotiations […]
Read More…
This Map of the Month was featured in the June 2003 issue of Trains magazine. We know railroads experienced a lot of traffic growth since they were deregulated in 1980, but where? And more importantly, which lines did better or worse than average? This map of western main lines compares the growth rate in tonnage […]
Read More…
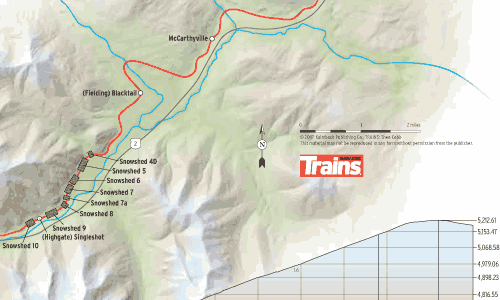
Great Northern Railway’s St. Paul, Minn.-Seattle transcontinental main line, now part of BNSF Railway, was built in the early 1890s as the northernmost such route in the United States, crossing the Continental Divide in the Lewis Range at Marias Pass, 5,213 feet above sea level. The Great Bear Wilderness in Lewis and Clark National Forest […]
Read More…

This Map of the Month appeared in the January 2004 issue of Trains. Al first glance, this looks like the route map of an airline. In reality, it’s BNSF Railway’s merchandise freight traffic network (i.e., cars not moving in unit trains from one common origin to one destination). It’s no coincidence they look the same, for […]
Read More…

Trains Magazine’s September 2010 “Map of the Month: Milwaukee Road Growth” maps the expansion of the Chicago, Milwaukee, St. Paul & Pacific Railroad, from a 20-mile line linking Milwaukee and Waukesha, Wis. (respectively, Trains’ past and current hometown) into a 10,733-mile transcontinental system over a scant 100 years. Any map charting this kind of expansion […]
Read More…
Dan Czech clearly remembers the first time he laid eyes on Union Pacific’s Bailey Yard. “I flew out here at night. I looked out the window and said, ‘That must be the city of North Platte.’ They said, ‘No, that’s the rail yard.’” The young terminal manager, who once taught Navy SEALs how to parachute, […]
Read More…
Intermodal haulage on railroads initially resembled loose-car railroading: Cities of varying sizes had ramps that originated a few flatcars, which were added to merchandise freights. A trucker, though, could beat that service easily. Larger cities generated solid intermodal trains, but the cost of terminals, equipment, and operations made the business lucrative only in lanes of […]
Read More…
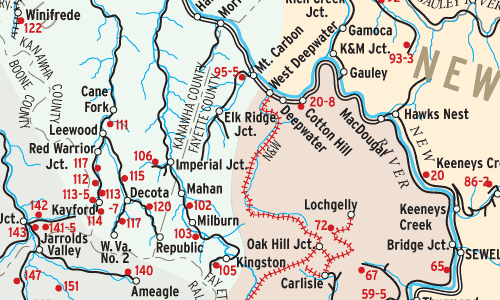
Eastern coal railroads issued maps of coal mines they served for the information of customers. This map (redrawn for clarity) shows C&O’s New River and Kanawha (Ka-NAW) Districts in 1966. their common border marks the divide between high and low volatile coal measures, an important distinction that determines whether coal is used to make coke […]
Read More…
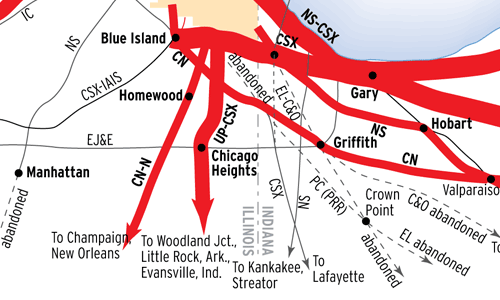
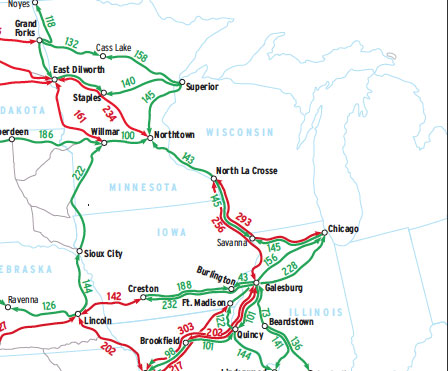
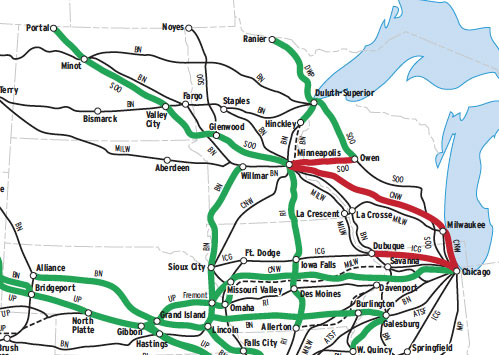
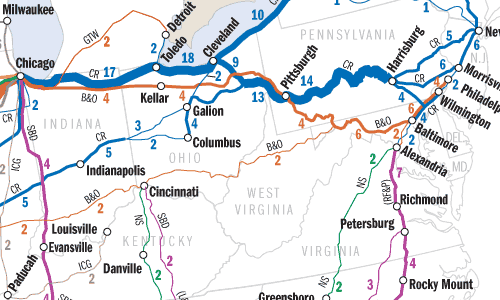
Traffic density changes in the past 30 years on freight railroads’ main lines to Chicago reflect factors both geographic and corporate. Geographic factors include the shift of manufacturing from domestic to offshore; air quality regulations that closed high-sulfur Western mines; and general population and economic growth. Corporate factors include the desire of railroad managements to […]
Read More…
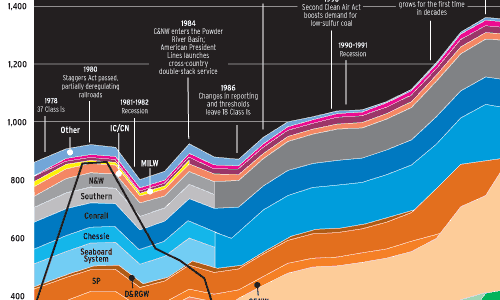
The undeniable triumph of U.S. railroading can be seen in this graph of revenue ton-miles: the most basic unit of measurement (hauling one ton of freight one mile) for the work railroads perform. The data for this illustration come from the Association of American Railroads, and are confined to Class I railroads, the largest group […]
Read More…
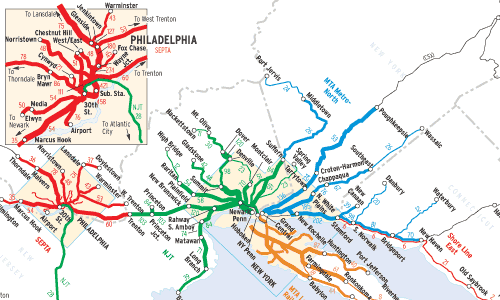
Think you’re in a hurry to get to work? The 3,170 trains on this map make it their business to hustle, with a purposefulness matched only by the riders packed aboard their coaches. This is a snapshot of the commuter trains that run every weekday in the Northeast. Without them, some of the biggest cities […]
Read More…
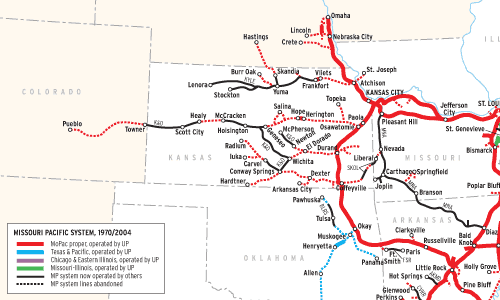
Before the mega-merger movement of the 1980s, only a few U.S. Class I systems attained route-mileage in five figures. Santa Fe, Southern Pacific, and Milwaukee Road did so by spanning the transcontinental West, Pennsylvania and New York Central bulked up in the East, and Chicago & North Western and Burlington Route (if you include its […]
Read More…