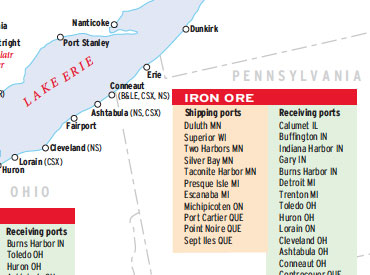
Great Lakes ports in 2003

TM0304

Commercial shipping on the Great Lakes follows a 2,300-mile corridor from the St. Lawrence Seaway to the western edge of Lake Superior. Over 200 million tons of cargo a year cross the five lakes and connecting waterways, hauled in some 150 U.S. and Canadian lakers, 50,000 barges, and about 1,000 visits by ocean-going vessels, or […]

Read More…

Grade profiles of the Pocahontas coal roads

TM1202

Compared here are the main lines of railroads that, for most of the 20th century, fed the nation with its most important natural resource: bituminous coal mined in Appalachia — the critical ingredient in power plants, steel mills, home furnaces, and factories. In 1927, the year of our comparison, the Chesapeake & Ohio and Norfolk […]

Read More…

Auto plants of North America, 2002

TM1203

In the early 2000s, North America’s 88 automobile assembly plants produced about 15 million new cars and trucks a year. And railroads moved 70 percent of the vehicles built in the United States alone. Most Canadian and U.S. plants are concentrated in a wide corridor stretching from Toronto to Mobile, Ala. Plants in Mexico are […]

Read More…

Atlantic Coast Line/Seaboard Air Line merger study

TRN-MO205

This Map of the Month appeared in the February 2005 issue of  Trains magazine. Say good-bye to two successful railroads,” was the startling way Seaboard Coast Line introduced itself in magazine advertisements in summer 1967. Below the picture of two streamlined diesels blurring nose-to-nose into each other, the ad continued with a gushing declaration: “The new […]

Read More…

Amtrak long-distance trains by night and day

TM1103

This Map of the Month was featured in the November 2003 issue of Trains magazine. Amtrak advertisements showcase images of passengers looking out windows at breathtaking scenery, and gleaming trains winding through spectacular canyons or along scenic river- banks. But that’s only half the story. Long-distance trains (those on routes of 750 miles or more) […]

Read More…

Union Pacific trains per day: 2001

TM1101

This Map of the Month was featured in the November 2001 issue of Trains magazine. Train frequency per 24 hours on the vast Union Pacific system, in first quarter 2001, is revealing both for what is indicated and what is not. Consider, if you will, the pre-1982 Union Pacific, i.e., before merger mania. With just […]

Read More…

Illinois Central’s roots

Roots-of-Illinois-Central

This Map of the Month appeared in the October 2007 issue of  Trains magazine. Like other great American railroads, the Illinois Central was a melting pot of many smaller lines — some acquired through lease or purchase, others set up by IC to construct new routes. This map charts the 88 different names that made up […]

Read More…

Norfolk Southern transformed

NS-transformed

This Map of the Month appeared in the August 2003 issue of   Trains magazine. Where does a railroad go? Might seem like the most basic of questions. But with trackage rights and service alliances, a railroad’s franchise — its sphere of influence — may extend far beyond the outermost mile of track it owns. […]

Read More…

BNSF Railway crew districts

BNSF-crew-districts

This Map of the Month appeared in the May 2004 issue of  Trains magazine. If a system map is an archaeological record of mergers, acquisitions, abandonments, and line sales, then a crew-district map is the record of all of these, plus technological change and traffic pattern change, with a great deal of law and contract negotiations […]

Read More…