WASHINGTON — Tariffs, geopolitical tensions, a persistently soft truck market, and an uncertain economy marked an eventful 2025, but U.S. rail traffic still managed to eke out a 1.5% gain last year.
All six Class I railroads, in fact, posted year-over-year gains in overall volume.
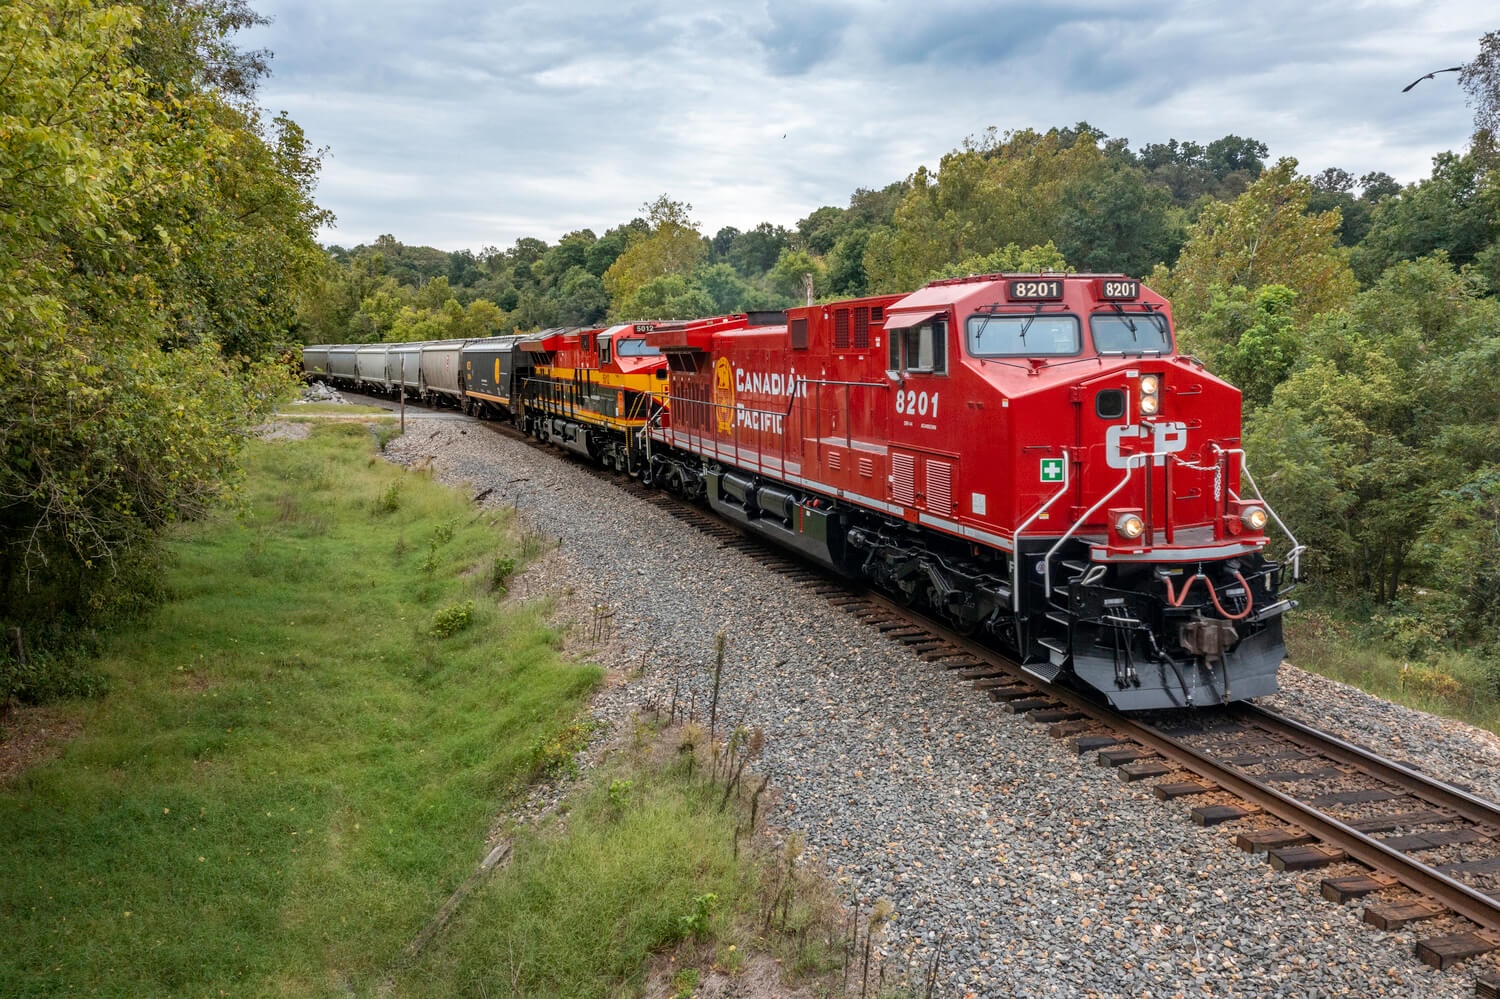
On paper, Canadian Pacific Kansas City recorded the biggest percentage increase in traffic across the industry in 2025, adding 3% in total volume.
Two separate work stoppages in Canada — one in August involving the Teamsters Canada Rail Conference and CPKC and CN and a second involving longshoremen at Canadian ports in November — led to multiple days of idled trains in 2024, making for easy comparisons in 2025 for both Canadian railways.
Notably, CPKC’s intermodal was up 8% for the year and its coal business was up 7% due to higher demand for metallurgical coal exports. Total merchandise volume slid 1% with CPKC volumes down 6% in forest products, 4% in metals, 3% for automotive, and 2% in energy. Its potash business was up 6% and grain ticked up slightly, outperforming 2024’s volumes by 2%.
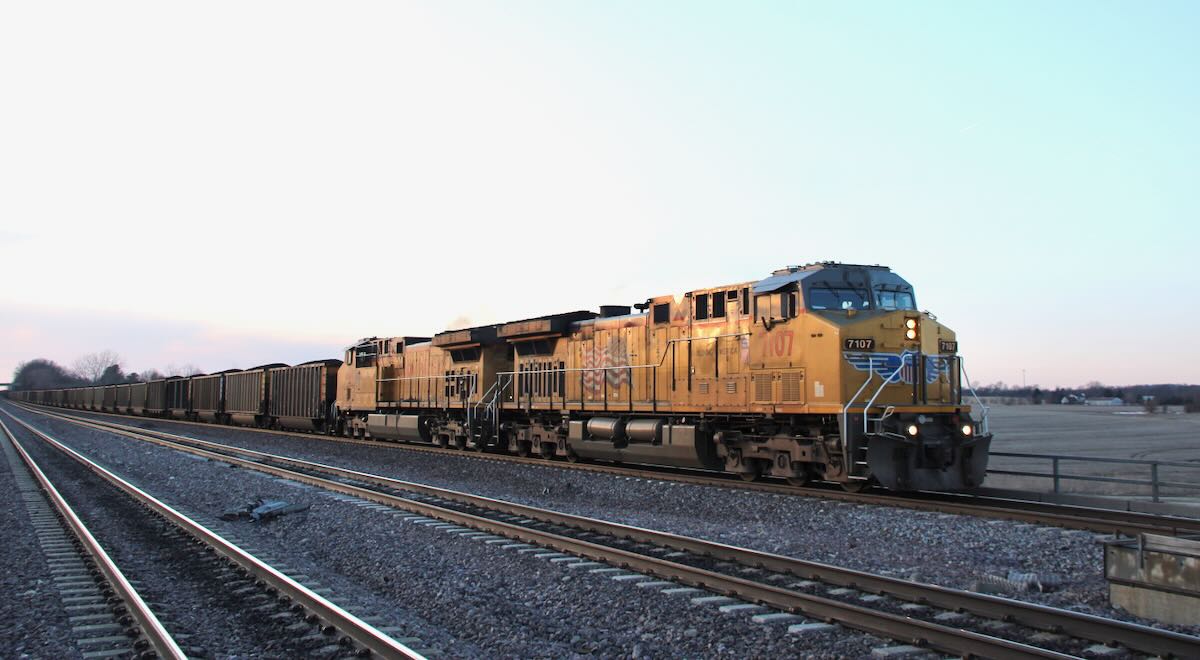
Union Pacific posted the next largest percentage gains, seeing a 2% rise in total volume. Its intermodal volumes were flat, handling slightly more 53-foot containers, but fewer trailers. Its coal franchise, citing new contracts in the Powder River Basin, resulted in a 15% increase in coal volumes for the year. Its total merchandise volume notched up 1% with mixed results across business groups. Volumes of iron and steel scrap increased 13%, primary forest products were up 9%, and grain volumes were 8% higher. Metallic ores slid 31% and lumber and wood products were down 6%. UP also saw smaller decreases in petroleum, pulp and paper, and automotive volumes.
Canadian National’s total volumes were up more than 1%, including a 6% increase in intermodal and a 4% increase in coal. The railroad’s merchandise volumes decreased 1%. This business was mostly affected by declines in minerals (down 8%) and forest products (down 6%). Petroleum and automotive volumes were flat, while grain was up 5% year over year.
CSX’s volume was up 0.7% for the year, including a 3% increase in intermodal. Coal volumes were down 1%, as an increase in domestic utility coal could not offset fewer export shipments. CSX’s merchandise volumes were down 1%. Food products and petroleum volumes were each down 7%. Lumber and wood products, along with pulp and paper products, were each down 6%. Chemicals slid 4%, automotive was down 3%, and primary forest products were down 3%. Non-metallic minerals, like phosphates, were up 5% and stone, sand, and gravel were up 4%.
BNSF Railway recorded a 0.6% increase in total volume for 2025. The railroad’s intermodal volume was up 1%. While it handled 22% fewer trailers, it increased its container volumes by 2%, as railroads continue migrating customers toward the standardization of the 53-foot container. Its coal volumes were flat and merchandise decreased less than 1%. BNSF saw a 24% decrease in metallic ores, a 17% decrease in forest products, a 7% drop in lumber and wood volumes, and a 6% decrease in stone, clay, and glass shipments. Offsetting these volume declines was a 5% increase in automotive, a 4% increase in scrap metals, and a 3% increase in primary metals. Grain traffic was also up 3% year over year.
Norfolk Southern notched a 0.3% increase last year. Its intermodal business slid 1%, but stronger shipments of domestic utility coal increased those volumes by more than 2%. NS was the only railroad, besides UP, to grow its merchandise business in 2025, increasing those volumes by nearly 2.5%, the largest of any Class I railroad’s merchandise business. In particular, NS saw a 16% increase in volume of both petroleum and non-metallic minerals, an 8% uptick in iron and steel scrap, and its automotive volumes climbed 7%. Most other commodities’ volumes were up slightly, or flat, with the exception of grain and food products, down 3% and 1% respectively.
Overall, Class I railroads’ U.S. rail volumes totaled more than 11.5 million carloads and another 14 million intermodal units for a total volume of more than 25.5 million carloads and intermodal units in 2025. That equals about 172,000 more carloads and 213,000 more intermodal units than 2024, according to data compiled by the Association of American Railroads.
— To report news or errors, contact trainsnewswire@firecrown.com.