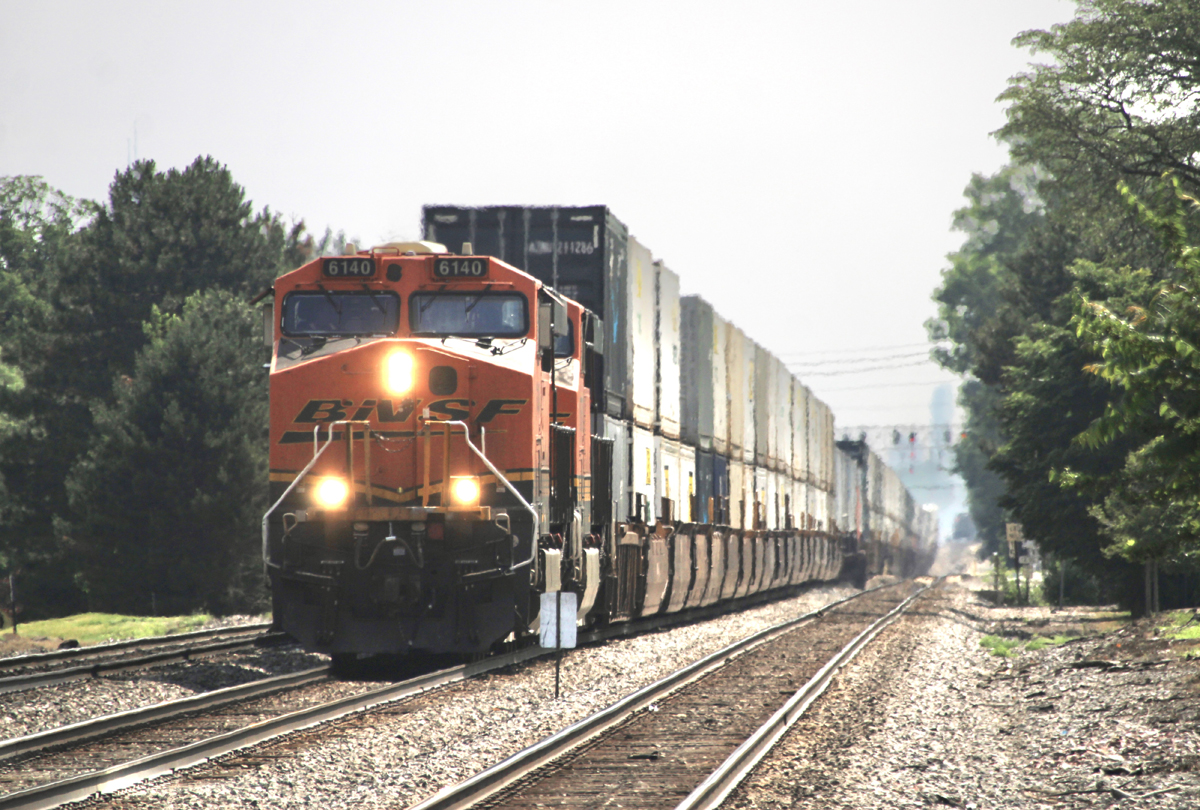
The SONAR data product offers numerous angles to get a read on the freight markets, primarily pertaining to the truckload, rail intermodal, and ocean sectors. One of the major trends in the data this year has been lackluster truckload demand, which SONAR measures as a volume of tenders, or electronically-submitted requests to move loads, directed to for-hire carriers.
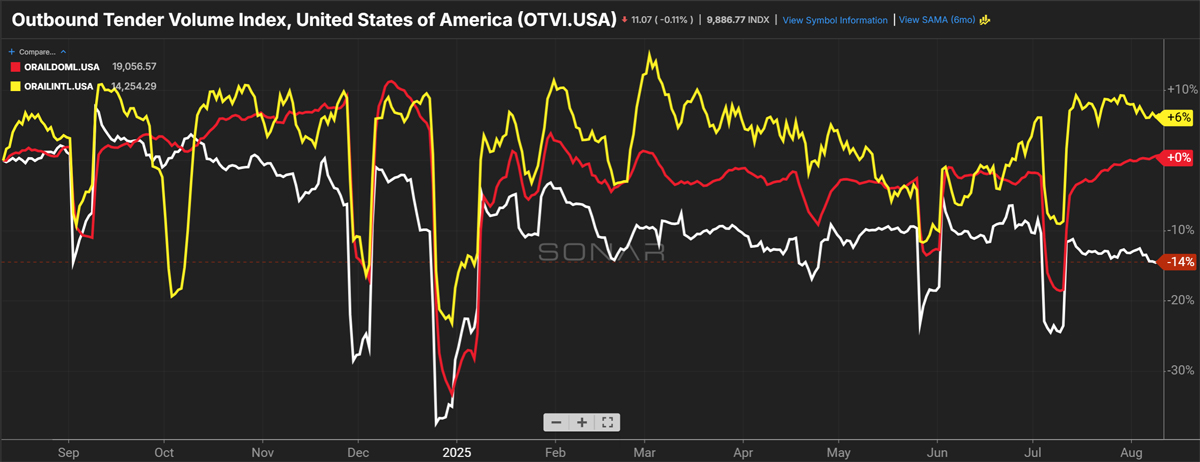
In the past week, the volume of truckload tenders, which primarily consists of dry van trailers, is down 14% year over year and roughly in line with 2019, a dismal freight year that is most remembered for large carrier bankruptcies.
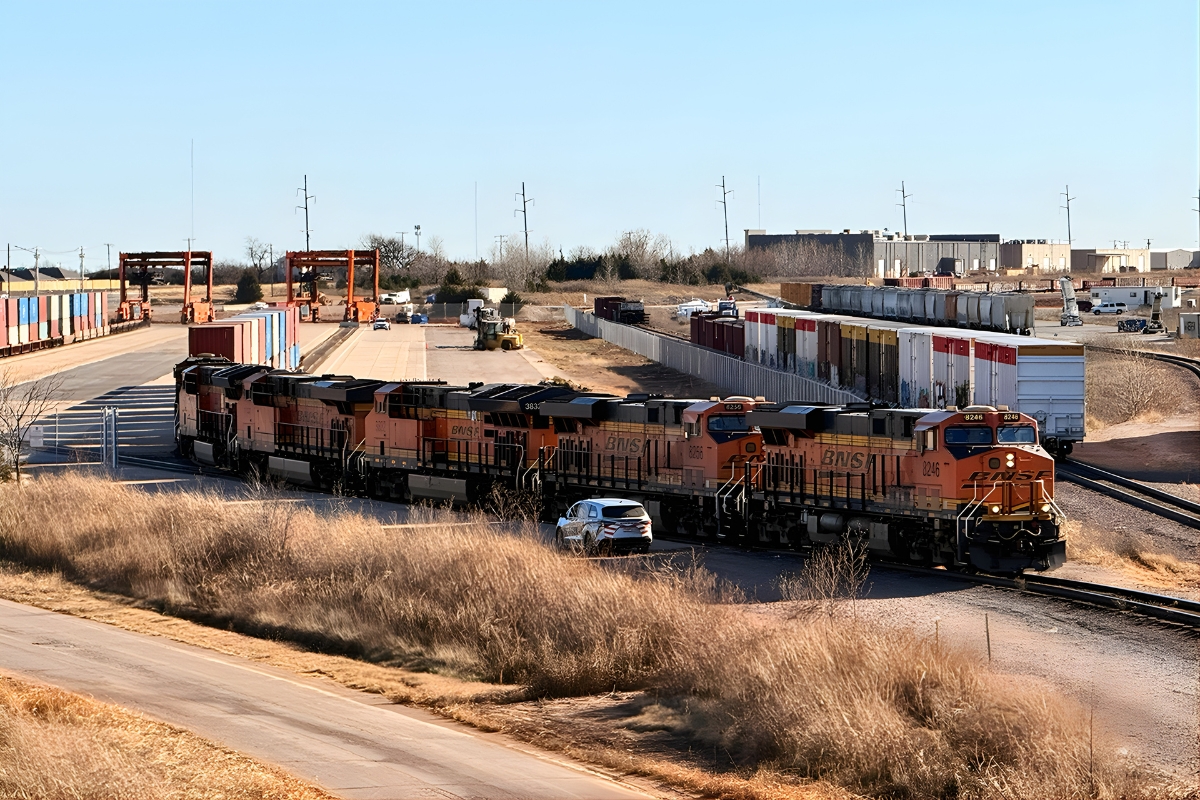
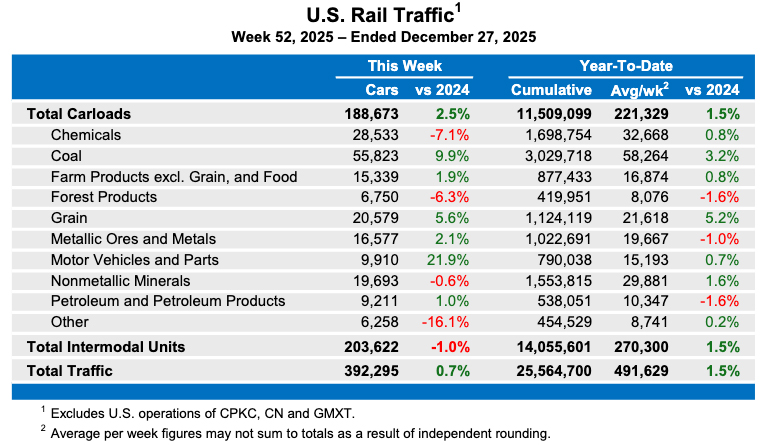
But intermodal volume has held up much better. Compared to last year, U.S. originations of loaded domestic and international intermodal containers are flat and up 6% year over year, respectively. Those volumes may not be wildly positive, but they look a lot better than truckload.
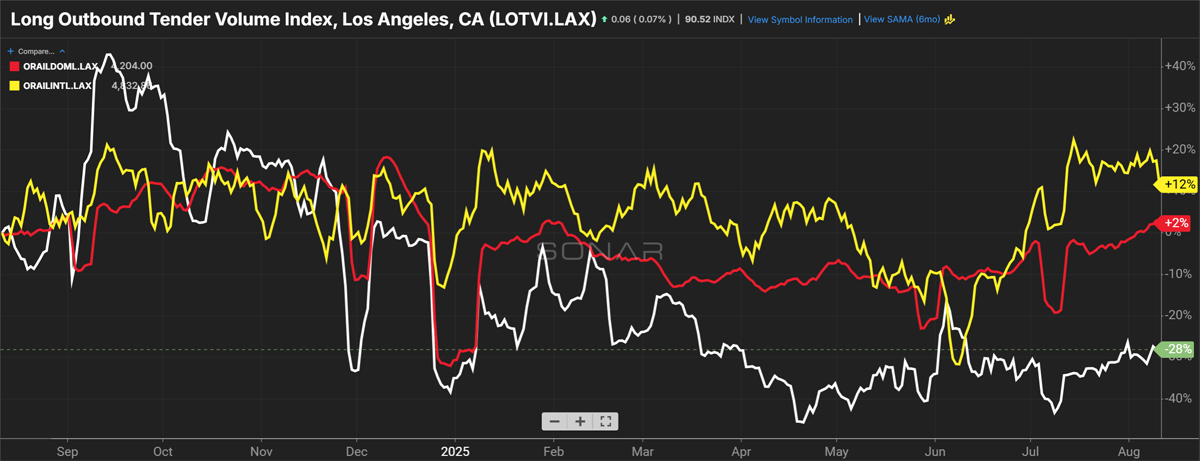
The volume difference between truckload and intermodal is even more apparent when limiting the datasets in ways to show direct modal comparisons. For instance, the truckload dataset can be limited to only long-haul volume (greater than 800 miles) and both datasets can be limited to originations from greater Los Angeles. Using those constraints, outbound LA tender volume is down 28% year over year, while outbound LA international and domestic volume are up 12% and 2% year over year, respectively.
There are numerous reasons for intermodal’s outperformance. This year has been a unique one as shippers moved oceangoing cargo early to avoid tariffs, leading to an early peak season and reducing imports’ time sensitivity. In fact, some shippers actually preferred intermodal’s slower transit time versus truckload as a low-cost method for carrying inventory. Another reason for intermodal’s relative volume outperformance includes degradation in interest-rate sensitive sectors of the economy, which disproportionately impacts truckload.
Supporting intermodal volume, rail service has been better than in many past years, and there is plenty of available capacity, at least in the domestic segment, as measured by the availability of domestic containers. Domestic intermodal carriers J.B. Hunt and Hub Group have both said on recent analyst calls that they could handle roughly an additional 20% volume with their current container fleets.
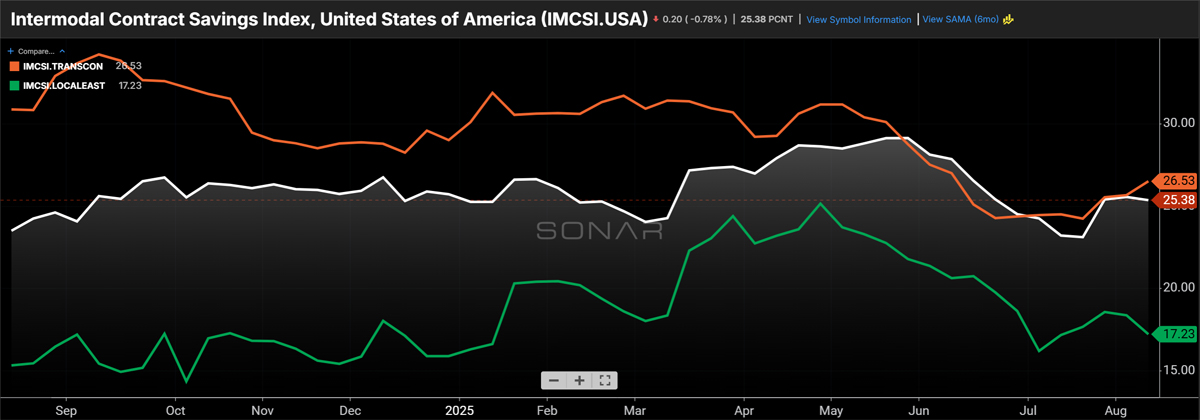
On top of all those reasons, the most important one is that intermodal is providing significant savings to shippers. Utilizing data from a third-party vendor, SONAR calculates an average intermodal savings of 25% for an average of 63 lanes, when fuel surcharges, a substantial portion of that savings, are included for both modes. Intermodal savings rates are also available at the individual lane level in the data product. The nationwide “savings rate” is roughly consistent with the average per-mile savings associated with the SONAR-developed LA outbound Headhaul Index, which shows an average savings of 27% across five lanes. As expected, the intermodal savings rate is narrower in “local east” lanes, which face much steeper competition from truckload, but the SONAR Local East Index reveals a substantial average savings of 17%, including fuel surcharges, across nine lanes.
About SONAR: SONAR, a Firecrown brand, is a comprehensive freight market intelligence platform providing high-frequency data and analytics for the global supply chain. It offers tools for forecasting, benchmarking, and monitoring the freight market, enabling businesses to make data-driven decisions and optimize their logistics operations. SONAR informs freight strategy for its clients, providing the context to proactively manage changing freight markets. Click here for a demo.
About the author: Mike Baudendistel is the head of intermodal solutions at SONAR, focusing primarily on the rail intermodal, ocean, and consumer packaged goods (CPG) industries. Prior to joining FreightWaves/SONAR, Baudendistel served as a senior sell-side equity research analyst covering the publicly traded railroads and companies that manufacture and lease railroad equipment, trucks, trailers, engines, and components. His experience following the freight transportation industry also touched the truckload, Jones Act barge, and domestic logistics industries. He is a CFA charterholder.





So volume is up for intermodal and containers because of longer shipping times? It cost less than truck and inventory is in no mans land for tax purposes and carrying cost when it is in transit.
The reason I mentioned it is some of my own experiences with companies like Gartner. While I don’t doubt the value of their research, I know it tends to be skewed because of what companies have paid to have their data included in the reports. This article mentions J.B. Hunt and Hub Group; does it also include data from Schneider, Swift, etc.?
No one cares about SONAR or knows what it is or does.
I am curious as to how you can verify that “no one knows or cares.” Is this just an opinion our do you have evidence?
As with any data, it can skewed a 100 ways to Sunday, it all depends on what you want to make it be.
Interesting article, but I’m wondering if knowing that SONAR is also a Firecrown brand will skew readers’ perceptions about the accuracy of the data. Have the analytics been verified by any other source?